


Progression in Smart Manufacturing: Setting Data Objectives around a Functional Problem
The single greatest impediment to the adoption of smart manufacturing may be the absence of information goals. Manufacturers do a great job promoting the network, the devices and technologies. But what is the end goal we are trying to realize? The concept of progression enables us to get started on the path, without necessarily having the big picture. At some point, we have to start turning data into valuable information. That’s where an information plan can help. Information planning can be packaged around small objectives as you are stepping into progression.
Objectives-based planning
We advocate an objective-oriented process, beginning with your specific objectives.
- What is your team or department trying to accomplish?
- What metrics are you trying to influence?
Drawing on the concept of cascading objectives, how do these impact higher level metrics in your organization, such as OEE? This is a creative process, and requires a degree of experimentation. Getting started is a lot easier if you can narrow focus to a more contained process, then apply lessons learned elsewhere.
Consider this example.
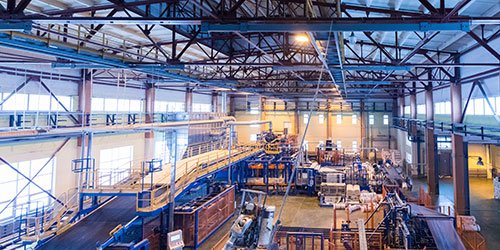
An industrial manufacturer operates six large mixers as part of its process. Each mixer supports a designated line of product. The site is not meeting its OEE objective, and preliminary findings suggest that mixer availability and quality are the root issues.
Machine Level Planning
At the machine/process/cell level:
- What are the supporting metrics of availability and quality? For example, unplanned downtime (hours).
- Further down, what are the driving metrics and root causes? For example, “# of breakdowns” and “component failure.”
A basic start may look like the image below.

This exercise is simply to align your
data objectives with plan goals, and inspire creativity.
As you work further through your objectives and metrics, ask yourself:
- Where are we missing the mark?
- What would accelerate our performance?
- What real time data could have told us this?
And that’s the key. What should the system tell you, on event, real time, that you had to discover here on your own? What data needs to be collected, organized into information, and shared?
Getting back to our example, we learned:
- There were intermittent inconsistencies with raw materials. While considered acceptable through quality control, they were affecting produced product quality in certain circumstances.
- There were a series of intermittent mixer motor trip incidents. This was resulting in process interruption, affecting both quality and availability.
- Quality issues seemed to exist on all three plant shifts, but third shift saw the most issues. Each shift was evaluated on productivity and quality, and each was meeting the productivity goals.
- Two of the motors ultimately failed, requiring rewinds, and one drive also failed.

Device level planning
After interviewing multiple parties, the team identified the missing data elements and those that needed to be brought together from other sources.

Experimentation
Several improvement opportunities were discovered as the new data became available, resulting in design improvements and personnel training.
- There were variations in product that were identified by inconsistencies in mixer output and motor torque. The effect on the system varied depending on product temperature, which also proved to be an issue.
- There were also operators who were simply overfeeding the mixer, motivated to exceed productivity goals. This resulted in nuisance trips. The problem seem to be intermittent as it was somewhat obscured by the rotating operator shift schedule.
- Shift electricians were also compensated (bonus) on production goals, and in some cases they were overriding the motor max start protection. This resulted in excess heat, in two cases driving motors to failure.
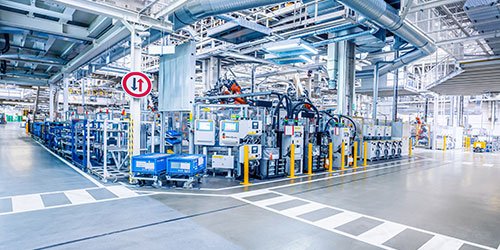
At first glance this would seem like a simple control and process problem; something that could be easily fixed through common design improvements. But once the smart devices and network foundation is in place, we can start experimenting with real-time data.
- Diagnostic data is monitored to trigger events, such as alarms or calls for inspection.
- Trends are captured, identifying abnormal peak changes through defined thresholds.
- Correlations between data points are discovered that can ultimately serve as prognostics.
The power of real-time data
Getting back to our example, real-time data quickly captured behavior of the best performing operator teams. This provided new training and procedures for other teams, improving both quality and productivity. Raw material variation issues were caught earlier, providing a means of real-time adjustment and notification to suppliers. As you can imagine, data testing and experimentation led to the need for more data points, introducing additional smart devices. Ultimately, the mixers were fully optimized for quality and production. Maintenance response improved as more devices were added to the network, providing additional real team diagnostics.
http://ciscocms.techdata.com/CiscoMomentum/EnterpriseNetworks

